R软件与多股票波动性及相关性的可视化
前言
在量化投资建模过程之前,有时候,我们需要对多只股票的价格走势、收益率序列、波动率等进行分析。下面给出使用 R 语言比较多只股票价格走势的完整解决方案。方案涵盖数据获取、清洗、可视化及基础分析全流程:
数据获取
安装与加载工具包
# 安装必要包(首次运行需取消注释)
# install.packages(c("quantmod",
#                    "tidyverse",
#                    "ggplot2",
#                    "zoo",
#                    "corrplot"))

library(quantmod)   # 获取金融数据
library(tidyverse)  # 数据处理
library(ggplot2)    # 可视化
library(zoo)        # 时间序列处理
定义股票代码与时间范围
# 股票代码列表(支持多市场,如A股需加 .SS/.SZ)
# 苹果、谷歌、微软、英伟达
stocks <- c("AAPL", "GOOGL", "MSFT", "NVDA")
# 时间范围
start_date <- "2023-01-01"
end_date <- Sys.Date()  # 获取当前日期
批量获取股票数据
# 获取数据
getSymbols(stocks,
           src = "yahoo",
           from = start_date,
           to = end_date)
## [1] "AAPL" "GOOGL" "MSFT" "NVDA"
# 处理数据
stock_data <- lapply(stocks, function(x) {
  data <- as_tibble(get(x)) %>%
    mutate(Date = index(get(x))) %>%
    rename_with(~ gsub(paste0("^", x, "\\."), "", .x)) %>%
    select(Date, Close) %>%
    mutate(symbol = x) %>%  # 添加股票代码列
    rename(price = Close)   # 重命名收盘价列
}) %>%
  bind_rows()

# 查看结果
head(stock_data)
## # A tibble: 6 × 3
##   Date       price symbol
##   <date>     <dbl> <chr>
## 1 2023-01-03  125. AAPL
## 2 2023-01-04  126. AAPL
## 3 2023-01-05  125. AAPL
## 4 2023-01-06  130. AAPL
## 5 2023-01-09  130. AAPL
## 6 2023-01-10  131. AAPL
数据清洗
处理缺失值
library(dplyr)
# 检查缺失值
missing_values <- stock_data %>%
  group_by(symbol) %>%
  summarise(missing = sum(is.na(price)))

# 填充缺失值(使用前向填充)
stock_data <- stock_data %>%
  group_by(symbol) %>%
  mutate(price = na.locf(price))
对齐时间序列
library(dplyr)
# 生成完整日期序列
full_dates <- tibble(Date = seq(as.Date(start_date),
                                as.Date(end_date),
                                by = "day"))

# 左连接填充所有日期
stock_data <- full_dates %>%
  left_join(stock_data, by = "Date") %>%
  group_by(symbol) %>%
  fill(price, .direction = "downup") %>%
  na.omit()
价格走势可视化
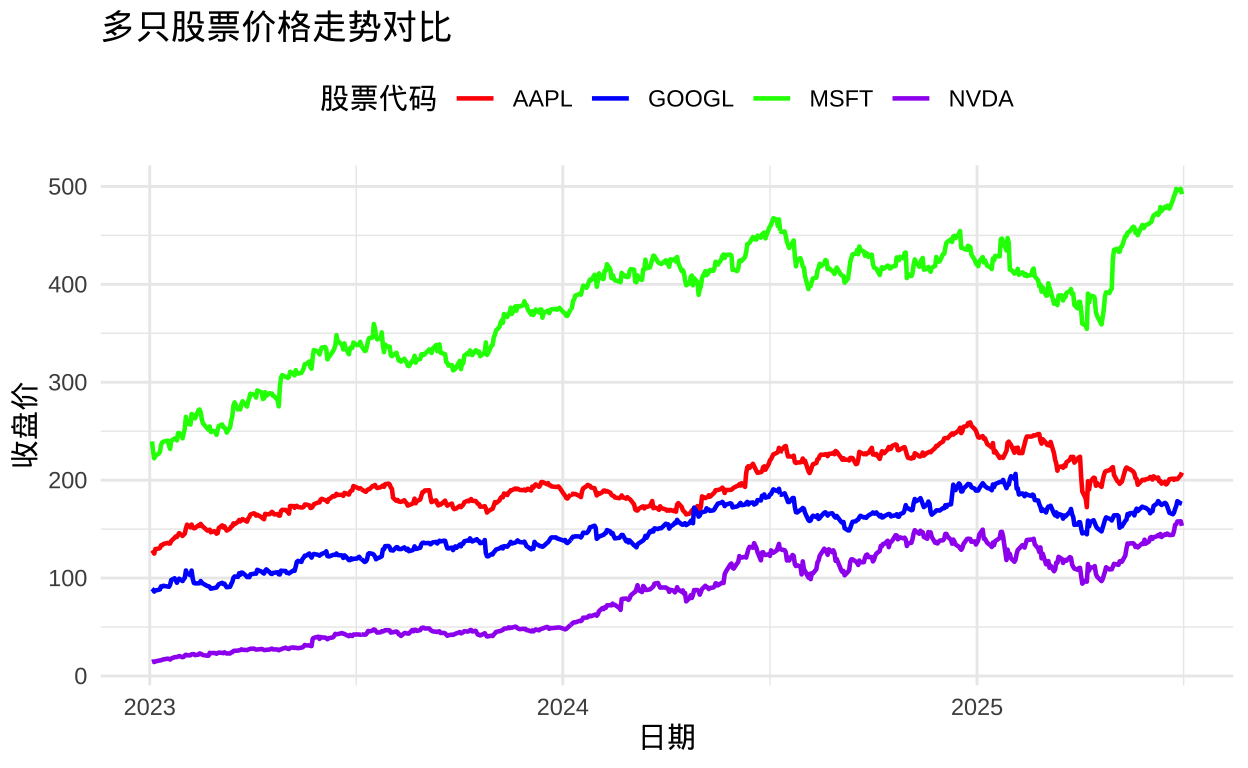
基础折线图
library(dplyr)
ggplot(stock_data, aes(x = Date, y = price, color = symbol)) +
  geom_line(linewidth = 0.8) +
  labs(title = "多只股票价格走势对比",
       x = "日期",
       y = "收盘价",
       color = "股票代码") +
  theme_minimal() +
  theme(legend.position = "top") +
  scale_color_manual(values = c("AAPL" = "red",
                                "GOOGL" = "blue",
                                "MSFT" = "green",
                                "NVDA" = "purple")
                     )
对数收益率对比
library(dplyr)
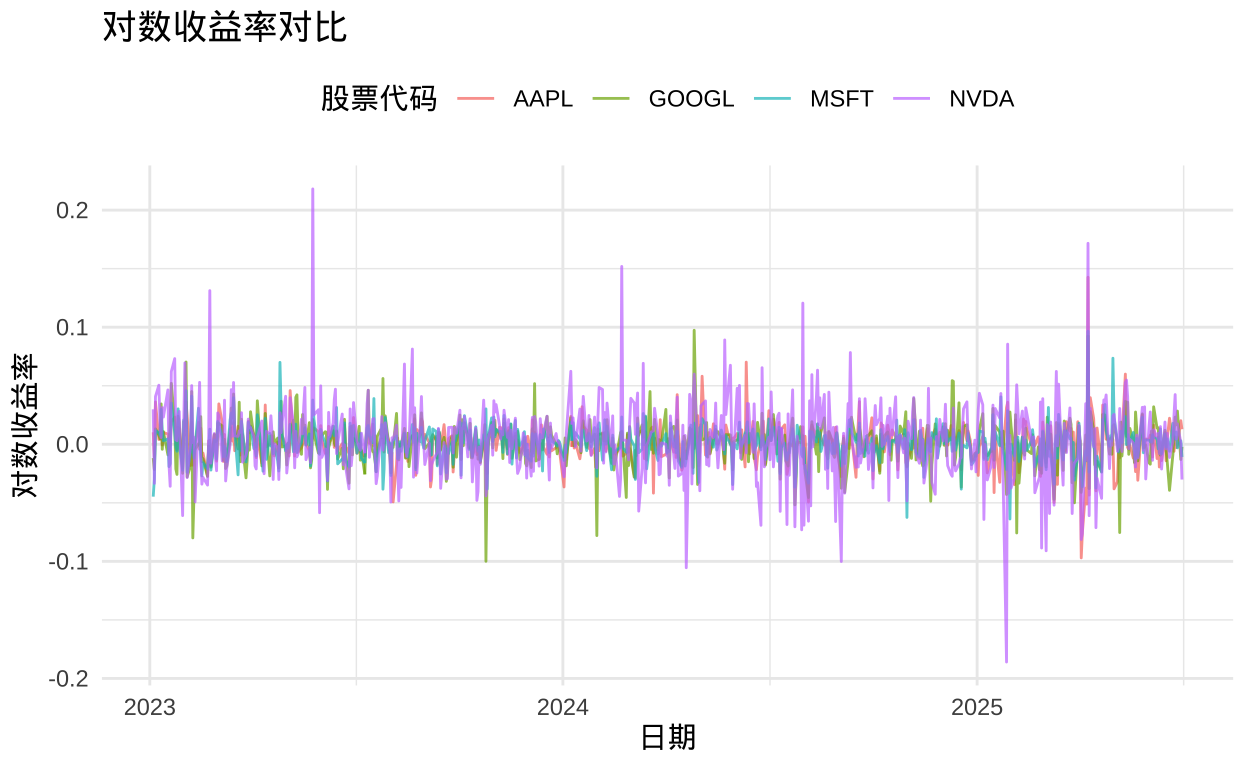
# 计算对数收益率
return_data <- stock_data %>%
  group_by(symbol) %>%
  mutate(log_return = log(price) - log(lag(price))) %>%
  na.omit()

# 绘制收益率曲线
ggplot(return_data,
       aes(x = Date, y = log_return, color = symbol)) +
  geom_line(alpha = 0.7) +
  labs(title = "对数收益率对比",
       x = "日期",
       y = "对数收益率",
       color = "股票代码") +
  theme_minimal() +
  theme(legend.position = "top") # 图例放底部
绘制对数收益率密度图:
library(dplyr)
ggplot(return_data, aes(x = log_return, fill = symbol)) +
  geom_density(alpha = 0.4) +  # 半透明填充
  facet_wrap(~ symbol, ncol = 2) +  # 按股票分面显示
  labs(title = "对数收益率密度分布对比",
       x = "对数收益率",
       y = "密度") +
  theme_minimal() +
  theme(legend.position = "top")  # 图例放底部

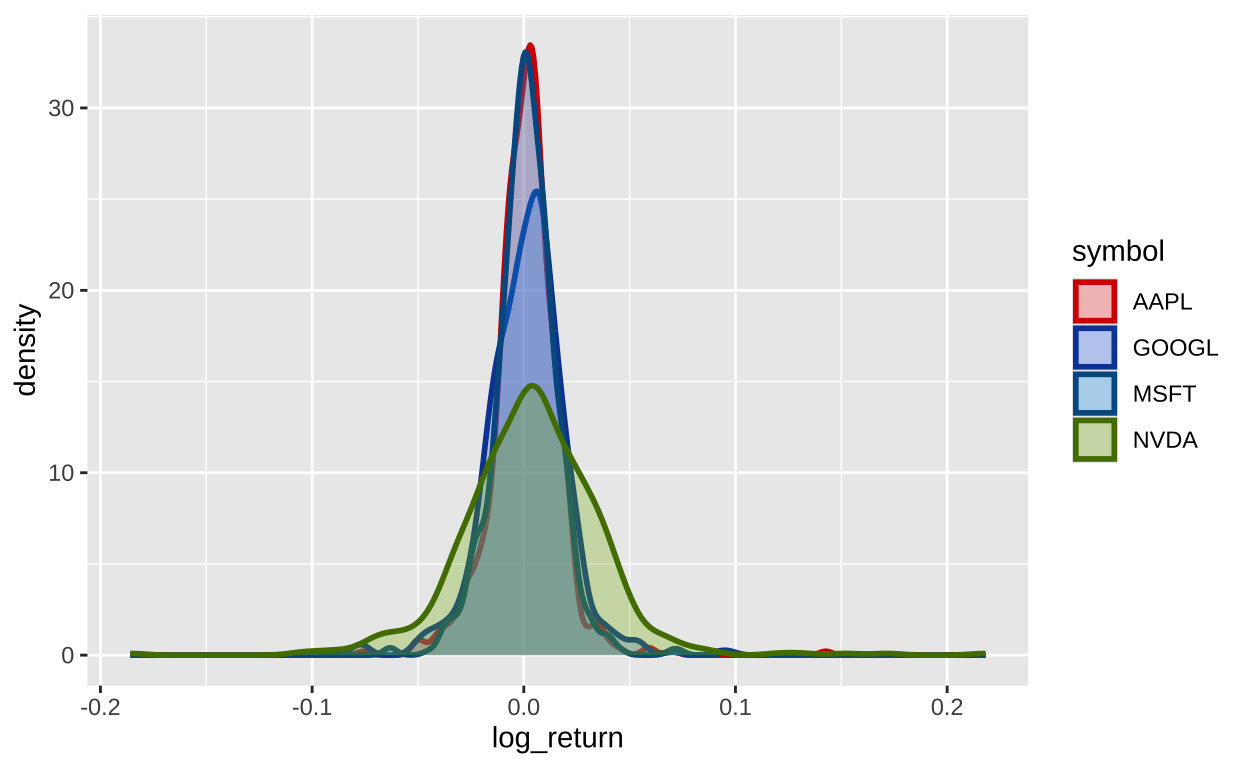
将密度图叠加以便于比较:
library(dplyr)
# 对数收益率密度图(叠加显示)
ggplot(return_data, aes(x = log_return, fill = symbol, color = symbol)) +
  geom_density(alpha = 0.3, linewidth = 1) +
  scale_fill_manual(values = c("AAPL" = "#FF5252",
                               "GOOGL" = "#4285F4",
                               "MSFT" = "#00A4EF",
                               "NVDA" = "#7FBA00")) +
  scale_color_manual(values = c("AAPL" = "#D50000",
                                "GOOGL" = "#0D47A1",
                                "MSFT" = "#005A8E",
                                "NVDA" = "#527D00"))
  labs(title = "对数收益率密度分布对比",
       x = "对数收益率",
       y = "密度",
       fill = "股票代码",
       color = "股票代码") +
  theme_minimal() +
  theme(
    legend.position = "top",
    legend.box = "horizontal",
    plot.title = element_text(hjust = 0.5, size = 14, face = "bold"),
    axis.title = element_text(size = 12),
    axis.text = element_text(size = 10)
  )
## NULL
还可以绘制箱线图:
library(dplyr)
# 箱线图对比
ggplot(return_data, aes(x = symbol, y = log_return, fill = symbol)) +
  geom_boxplot() +
  labs(title = "对数收益率箱线图对比",
       x = "股票代码",
       y = "对数收益率") +
  theme_minimal() +
  theme(legend.position = "top")

股票数据特征的统计分析
计算波动率
library(dplyr)
volatility <- return_data %>%
  group_by(symbol) %>%
  summarise(volatility = sd(log_return, na.rm = TRUE)) %>%
  arrange(desc(volatility))

print(volatility)
## # A tibble: 4 × 2
##   symbol volatility
##   <chr>       <dbl>
## 1 NVDA       0.0314
## 2 GOOGL      0.0191
## 3 AAPL       0.0161
## 4 MSFT       0.0146
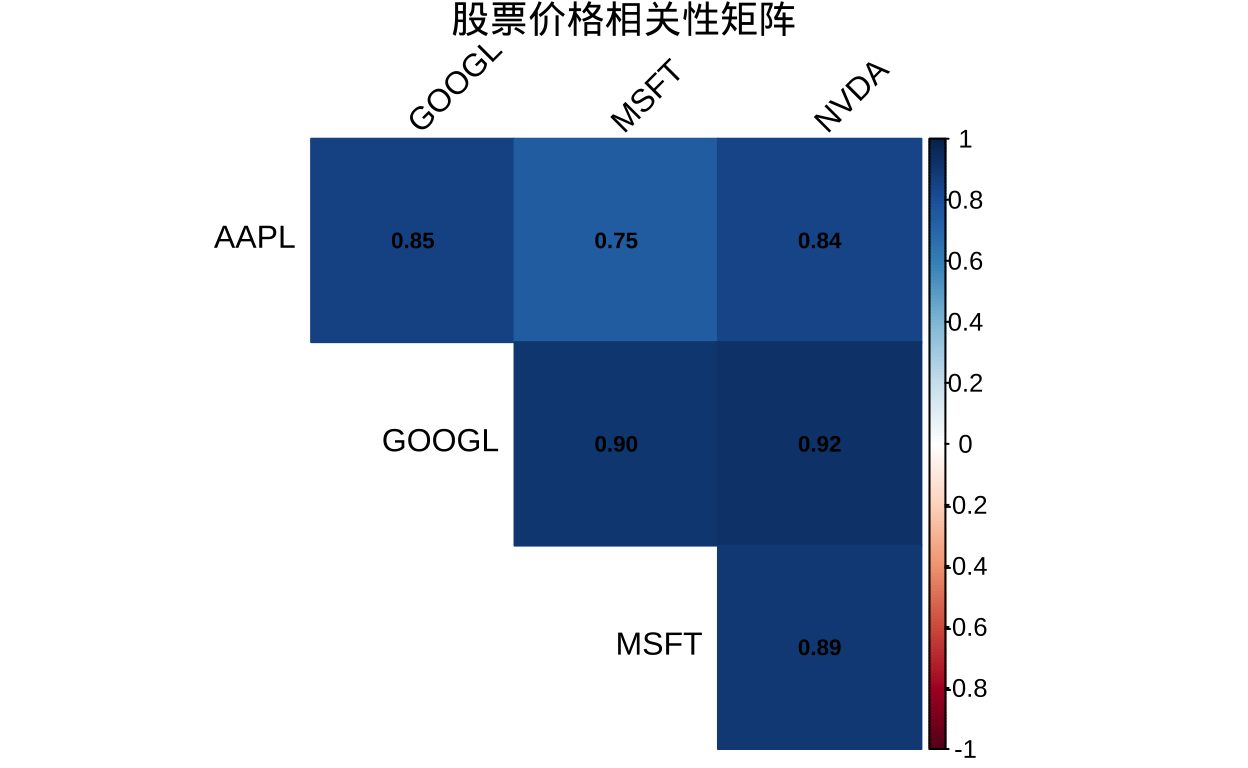
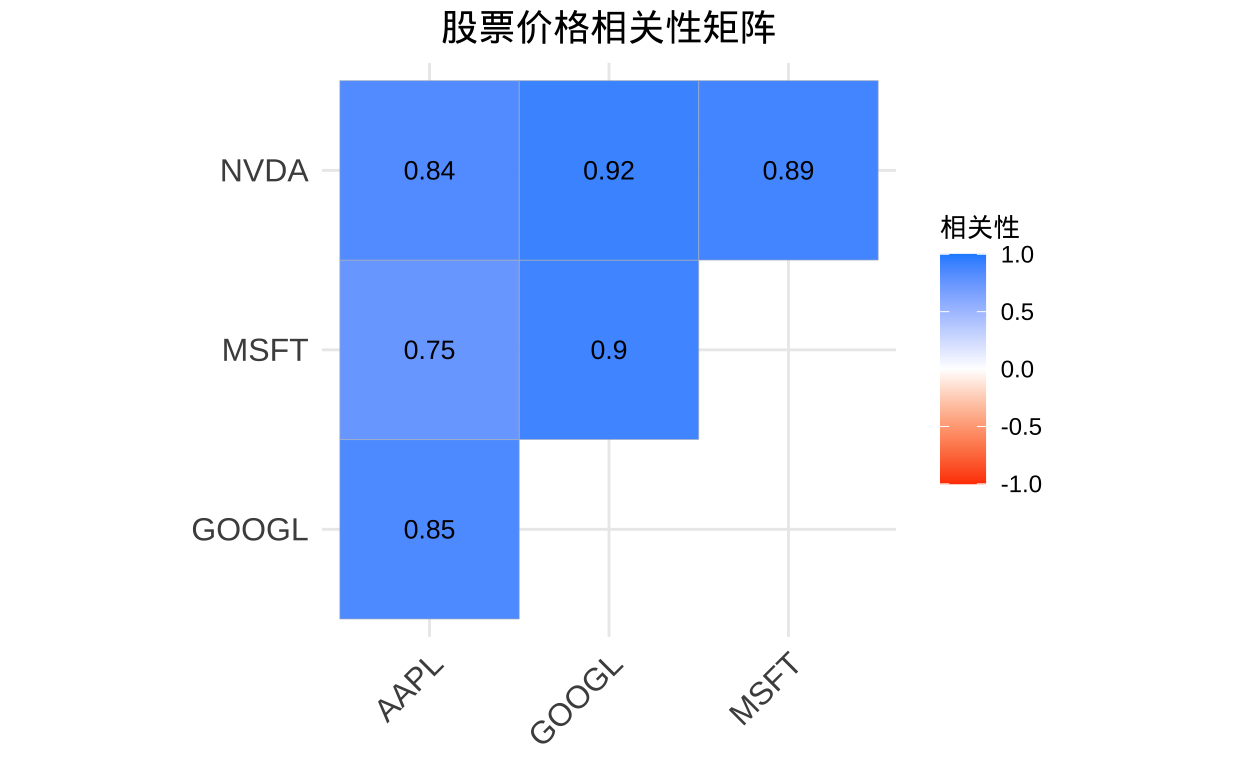
相关性分析
library(dplyr)
# 转换为宽格式
price_wide <- return_data %>%
  select(Date, symbol, price) %>%
  pivot_wider(names_from = symbol, values_from = price) %>%
  column_to_rownames(var = "Date")

# 计算相关系数矩阵
cor_matrix <- cor(price_wide)

# 可视化相关系数
library(corrplot)

# 绘制相关性矩阵(暖色调)
corrplot(cor_matrix,
         method = "color",      # 颜色填充
         type = "upper",        # 只显示上三角
         tl.col = "black",      # 标签颜色
         tl.srt = 45,           # 标签倾斜角度
         title = "股票价格相关性矩阵",
         mar = c(0,0,1,0),      # 边距调整
         addCoef.col = "black", # 添加相关系数数值
         number.cex = 0.7,      # 系数文字大小
         diag = FALSE)          # 不显示对角线
# 计算相关系数矩阵
cor_matrix <- cor(price_wide)

# 使用ggcorrplot绘制ggplot2风格的相关性矩阵(暖色调)
library(ggcorrplot)

ggcorrplot(
  cor_matrix,
  method = "square",          # 颜色填充
  type = "upper",            # 只显示上三角
  colors = c("#FF4500", "#FFFFFF", "#1E90FF"),  # 自定义颜色(红-白-蓝)
  lab = TRUE,                # 显示相关系数
  lab_size = 3.5,            # 系数文字大小
  title = "股票价格相关性矩阵",
  ggtheme = theme_minimal(), # ggplot2主题
  show.legend = TRUE,        # 显示图例
  legend.title = "相关性",
  tl.col = "black",          # 标签颜色
  tl.srt = 45,               # 标签倾斜角度
  digits = 2                 # 保留两位小数
) +
  theme(
    plot.title = element_text(hjust = 0.5, size = 14, face = "bold"),
    axis.text = element_text(size = 10),
    legend.text = element_text(size = 9),
    legend.title = element_text(size = 10, face = "bold")
  )
导出数据
# 导出为 CSV
# write_csv(stock_data, "stock_prices.csv")

# 导出为 Excel(需安装 writexl 包)
# install.packages("writexl")
# write_xlsx(stock_data, "stock_prices.xlsx")
小结
本文的数据来源为雅虎财经(Yahoo Finance),若需更专业数据,可考虑 WRDS 数据库(需机构订阅)。
在 R 软件包的选择上,我们使用了 quantmod 包以快速获取数据,但该软件包返回的是 xts 格式,后续计算过程中需转换为 tibble 。
数据处理过程借助于 tidyquant 包,该软件包可以返回整洁格式的数据,与 tidyverse 兼容性更好。
缺失值处理方面,前向填充(na.locf)适用于短期缺失,多重插补(mice包)可处理复杂缺失模式。可视化优化方面,可以使用scale_color_manual自定义颜色。此外,可以添加geom_smooth拟合趋势线(如method = “loess”)。
通过以上步骤,我们可以高效地获取、清洗并可视化多只股票的价格走势,结合波动率和相关性分析,为投资决策提供数据支持。